

Geography Without Sight
A UI doctoral student, inspired by a blind student, has created a curriculum to help teach geography to the visually impaired
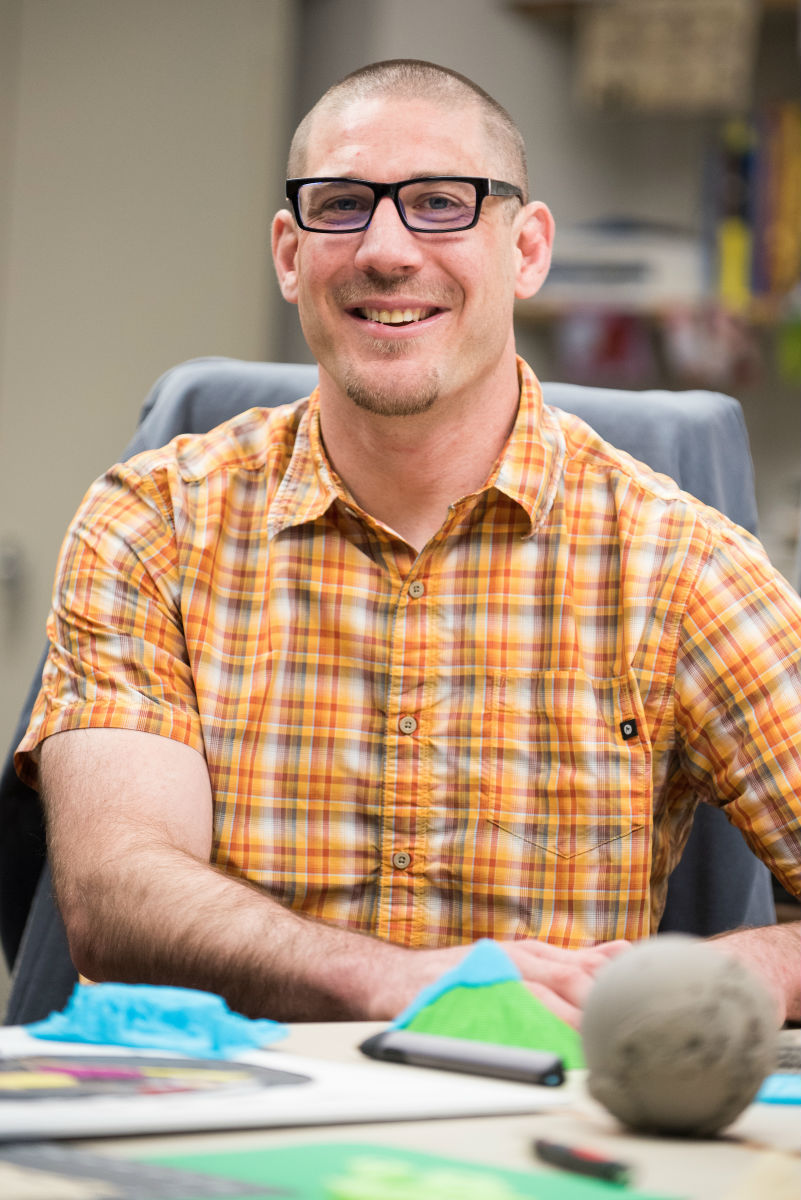
Travis Cowles’ Physical Geography class focuses heavily on the visual elements of planet Earth.
He flips through pictures of Pangea and how continents formed. He displays graphic tables that highlight average annual rainfall of different terrains across the globe. Cowles has long relied on photos, graphs and PowerPoint slides to help his students comprehend basic concepts of the world’s physical features.
That all changed in fall 2016. After his first Geography 100 lecture of the semester, a student approached him.
“Someone came up to me and said, ‘I just registered for your class, and by the way, I’m blind,’” Cowles said. “I realized that the majority of what I do will not work for her.”
Alana Leonhardy, 23, was looking for another lab science to satisfy requirements of her bachelor’s degree in psychology and picked geography as a last-minute selection. She is completely blind without any light perception, so even larger-print graphics that are used by low-vision students weren’t useful to her.
“We had to think of other ways to get that in my brain,” she said.
Cowles, who is finishing his doctorate in geography from the University of Idaho College of Science, scoured the internet in a frenzy. He tried to find anything that might help him explain his visual-aid-based lessons to a student who couldn’t see them.
Travis Cowles wants to help other instructors and students teach geography to those with visual impairments. Map instructions and lesson plans are available online at Geography without Sight. Educators can print the legal-paper-sized maps and use craft supplies to create their own versions at a cost of about $5 to $10 apiece.
“Literally the first week of class I said, ‘I don’t know what to do,’” he said.
The conundrum showed Cowles that there isn’t much readily available to help visually impaired students with geography.
So he started his own curriculum.
Cowles met with the UI Doceo Center and recruited some undergraduate geography students to research the best way to explain continental drift to someone who can’t watch the worldwide land shift take place.
Their results have proven that with a little creativity, along with a 3-D printer and some craft supplies, anyone can learn classroom-based lessons about the world’s lands and waters in a tactile way.

Limited Availability
Little is commercially available to teach geographic concepts in a non-visual way — with the exception of 3-D globes and a handful of topographic maps. What is available is expensive.
To come up with some less expensive tactile maps, Cowles turned to senior geography students in graduate student Courtney Thompson’s cartography class who were looking for a capstone project.
“We came across not much,” said Nick Fuller, 22, one of three students who worked on the maps as part of his senior project. “No one had done it for a general audience. It was maybe one geology class someone had adopted it into.”
The plans started out small. Thick ink from 3-D pens at the Doceo Center allowed Cowles to make rudimentary drawings to represent the rings that show the age of a tree or how rivers branch off and form smaller streams. A hand can feel each line drawn with the pens, which are made from a quickly drying glue.
The drawings with the pen were hit or miss, but Leonhardy said the clearly drawn projects worked wonderfully.
The team didn’t have the funding to make tactile maps commercially, so they made their own. Fuller, along with students Abigail Alkire and Sam Ross, started by making “low-vision” maps that are bigger and depict less information than a traditional map.
Then, to find ways to create maps that could be used to describe the lessons he was teaching in class, Cowles met with Virtual Technology and Design faculty members John Anderson and Roger Lew in the College of Art and Architecture.

“With the technology today, we have so many things available, we just have to be willing to put these things together in an understandable way. How can we take everyday objects and convey them in a way that someone will understand?”Travis Cowles
“Anything where we needed to show a picture, we would try to convey a picture in a tactile way,” Cowles said. “Through the semester, we decided we needed more maps.”
The group also used a 3-D printer to create renderings of Mount St. Helens that allow the user to count elevation before and after the explosion, as well as a hurricane model that can help the holder better understand the physical structure of wind-swept storms and spiraling rain clouds.
While the students worked on their designs, Leonhardy met weekly with Cowles to go over materials and study the geographic concepts.
“There was a lot of planning that had to go into it and a lot of resources from the ground up,” Leonhardy said of the project.

Trial by Fire
Fuller and Alkire spent a semester trying to get their patterns just right. Alkire helped make a base map so all future projects could follow the same patterns. The continents and oceans on all of the maps would be the same size and shape.
“We wanted to have the outline of the continents be different from the water,” she said. “That was a first step to figure out how the continents could be different from the rest of the map.”
Fuller focused his map on global mountain ranges. In addition to using different materials – including craft beads – to represent different terrains, the Meridian native also tried to focus on making sure a student with color blindness and other low-vision impairments could decipher all the detail.
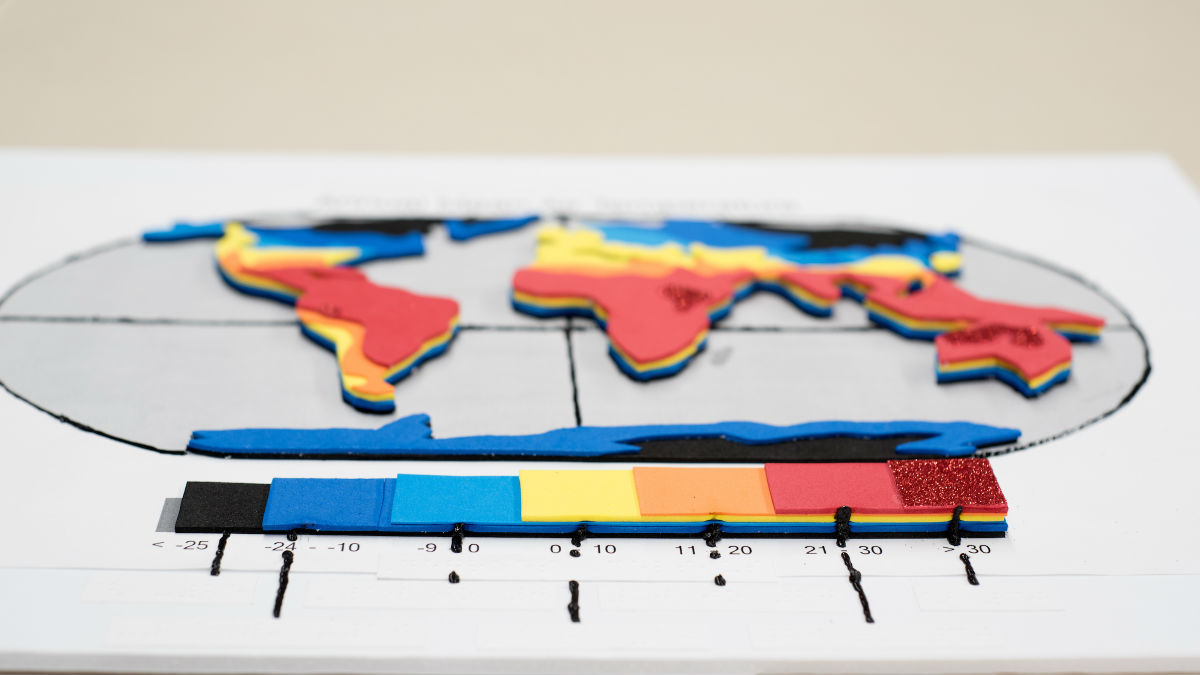
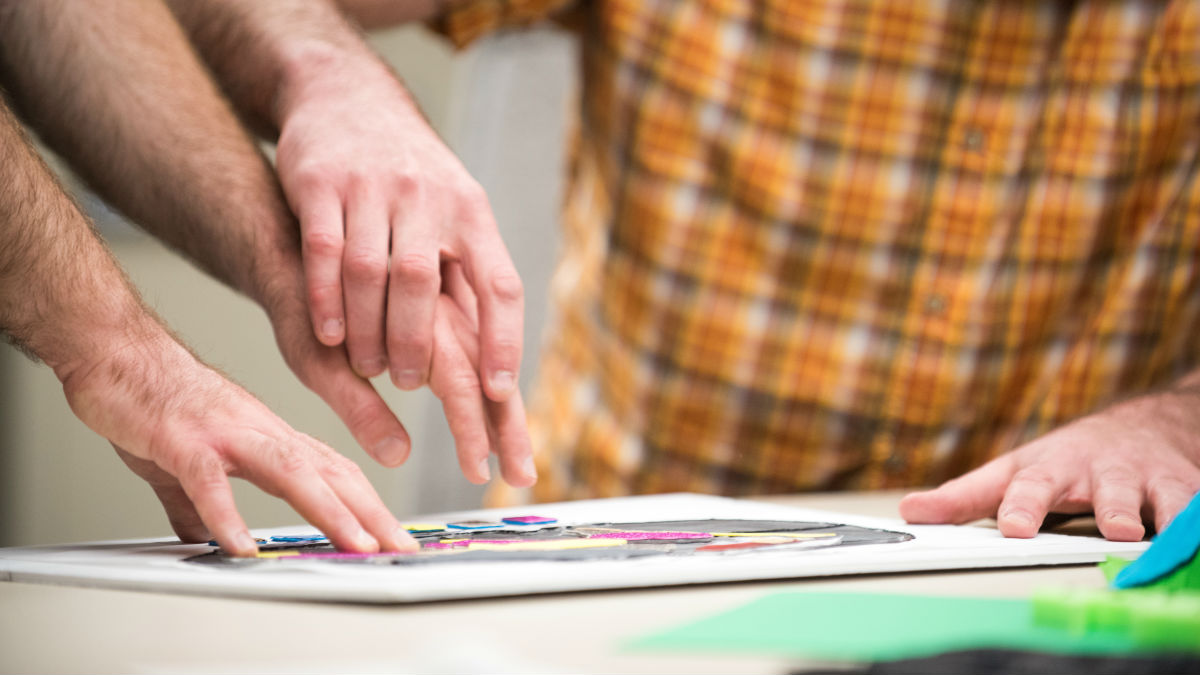
The different colors on a graph of climate types by region were replaced with glitter foam, sandpaper, and cardboard with different tactile consistency. Magazine paper and corrugated cardboard served as tundra and mountain ranges.
“It was kind of a gamble, I was worried for a little while,” said Alkire, 21, from Horseshoe Bend, Idaho.
But, they quickly realized, if the maps felt different enough for sighted students, they would feel different enough for Leonhardy.
A Braille map legend appears at the bottom of each map so a blind student can decipher what concept is being conveyed. U of I’s Center for Disability Access and Resources (CDAR) office helped translate much of the map information into Braille, while the Doceo Center used its 3-D printer to create some of the models that were used to explain elevation.
It took much of the past year for Cowles and his team to develop the curriculum, though Leonhardy was eventually able to use and experience the finished project this spring.
“Her enthusiasm is what made this so much easier to do,” he said. “I enjoy being a teacher, and when students are interested in learning, it makes it so much easier.”
Cowles worried they hadn’t done enough to get the concepts across, but Leonhardy’s response to the maps was a positive one.
“I was blown away,” she said. “I’ve been in school for four years now. I have never had a department go so far to create something that was going to work not only for me but for other students as well.”
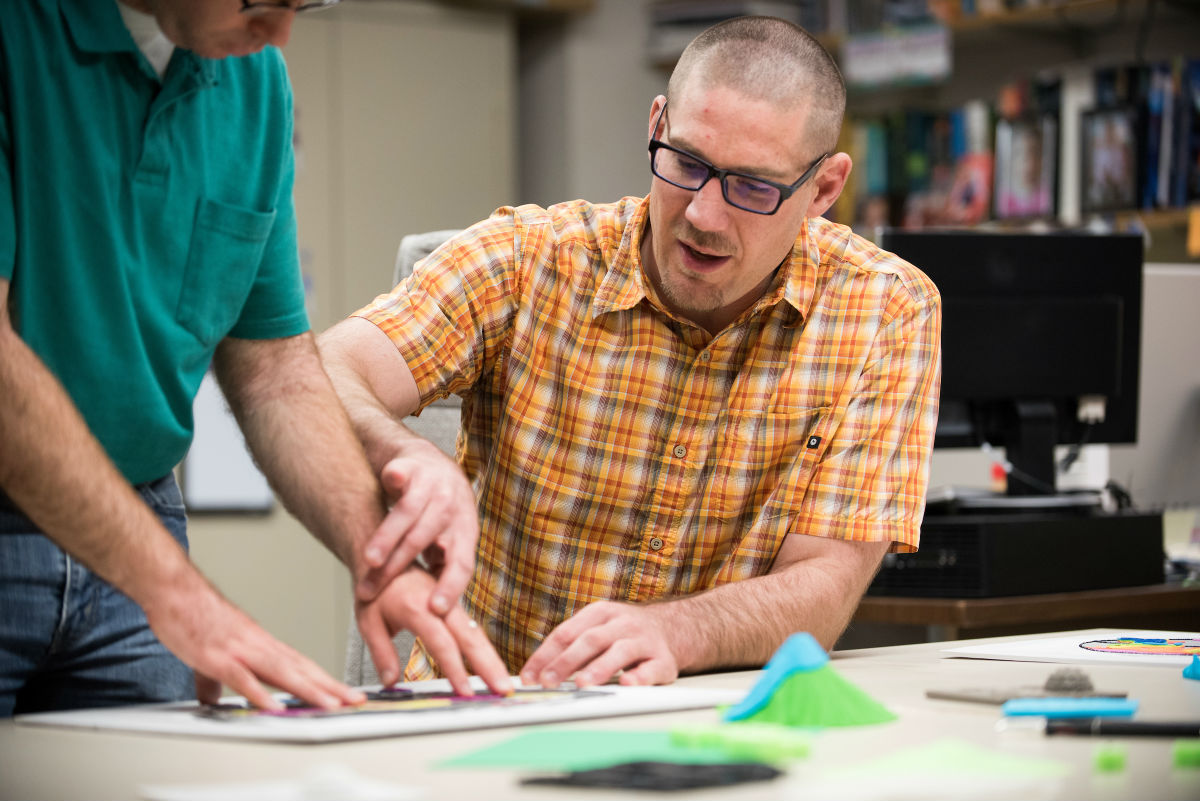
Leonhardy said some of the maps used different textures while others used different heights that helped her understand using her hands.
“The feedback we got from her was really great,” Alkire said. “So, I think it went really well.”
The project gave Alkire and Fuller a new perspective on how to make education accessible for all students.
“It’s really changed my focus a little bit,” Alkire said. “It was a really cool introduction to a whole other world that I didn’t even know about.”
Leonhardy got an A in the class. And she is heartened that all the people involved in the project believed in her just as much as someone without a visual impairment.
“I think I mastered the material in part because the material was made accessible to me,” she said. “If I hadn’t had those charts and those explanations, there would have been some things that I just couldn’t grasp.”
Article by Brad Gary, University Communications and Marketing.